Discharging Secondary Batteries
Part of Chapter Battery Systems
THE CAPACITY OF a storage battery – that is, the useful amount of electricity that the battery can provide – is measured and expressed in ampere hours (Ah). A battery that can provide 10 amperes for eight hours is said to have a capacity of 80 Ah.
Of course, this is a fuzzy measurement. First, the rating assumes that you discharge the battery at a constant current of 10 A. That says nothing about the terminal voltage at the end of discharge. The following explanation uses a lead-acid battery as an example.
Stationary industrial batteries are usually rated at the eight-hour discharge rate, as in the example above. Capacities for automotive and other small batteries are frequently given at the 20-hour rate. To provide meaningful data for comparing batteries, manufacturers standardize the capacity tests by setting the end-of-discharge (EOD) voltage to a fixed value, usually 1.75 VPC (volts per cell). They may give supplemental data for discharges to other end voltages; 1.5 VPC and 1.8 VPC are common values.

Why different discharge voltages? It turns out that the capacity you can get from a battery, in Ah, depends on the discharge rate. The faster you discharge the battery (that is, the higher the current), the less capacity you can realize.
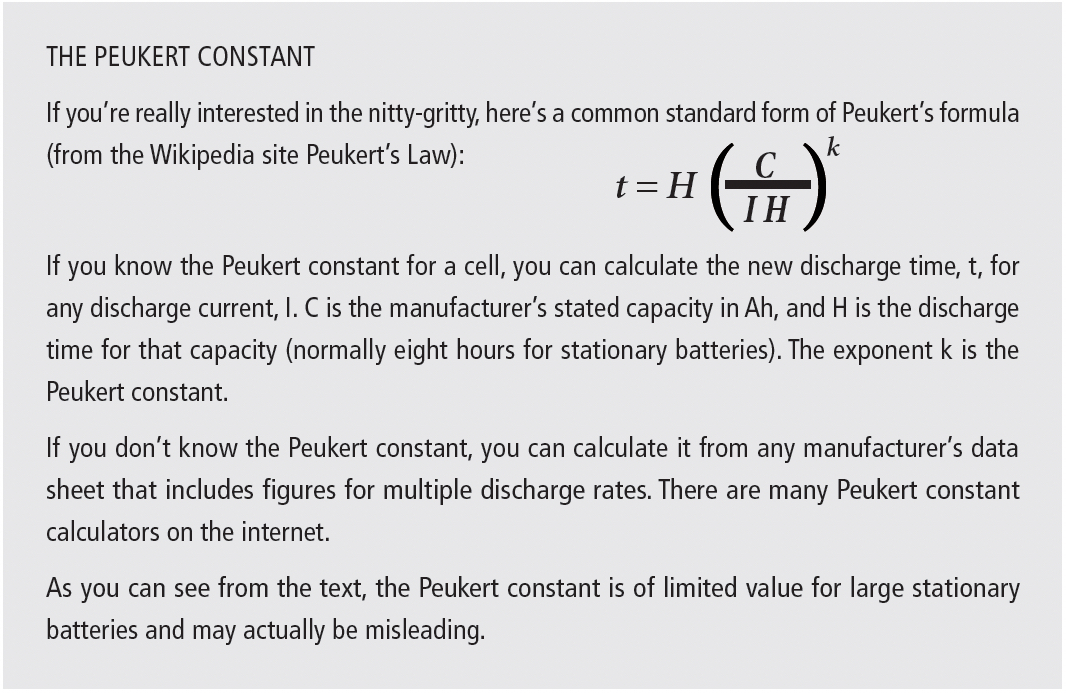
This phenomenon was recognized early in battery history. The German scientist Wilhelm Peukert observed this behavior, and in 1897 developed an empirical formula to describe battery performance. [Peukert, pronounced Poikert, is relatively unknown, but his equation is very popular.] See the boxout The Peukert Constant for details.
Industrial battery manufacturers, however, haven’t latched onto Peukert’s potentially helpful math. There a few probable reasons for this:
- Batteries that are discharged at a high rate may be discharged to an EOD voltage lower than 1.75 VPC. Uninterruptible Power System (UPS) batteries, for example, are usually discharged to 1.5 VPC or lower, at rates from 1 minute to about 15 minutes. Conversely, when you discharge at a low rate, you should terminate the discharge at a terminal voltage higher than 1.75 VPC. The Peukert constant is based on discharging to the same end voltage regardless of the discharge rate. This makes Peukert’s law difficult to apply to applications like UPS.
-
The so-called Peukert Constant (for lead-acid, a number between 1.1 and about 1.4) isn’t constant. A quick check of one battery spec sheet shows a range of 1.30 to 1.45 for discharge rates of 3 hours to ½ hour.
-
The constant increases as the battery ages. A constant supplied by a manufacturer for a new battery will give unreliable results for a well-seasoned battery.
-
The available discharge capacity is also a function of temperature, so a discharge test needs to adjust the resulting data for temperature. Peukert didn’t explain how to do this.
- Peukert doesn’t account for self-discharge at very low discharge rates.
So, industrial battery manufacturers’ data include tables or graphs to help you determine usable capacity, without mention of Peukert. If you’re building electric vehicles, though, people will Peukert you to death.
Three discharge methods are in common use to measure the Ah capacity of a battery: Constant Resistance, Constant Current, and Constant Power. In the real world, of course, batteries are rarely discharged at constant anything. We’ll cover variable-rate discharges a little later, using an analysis procedure called Hoxie’s method.
CONSTANT RESISTANCE DISCHARGE
1.4.1
A constant resistance discharge is the easiest to perform: just connect a fixed resistor to the battery and record the time it takes to reach the EOD voltage. It’s normally used for small cells to provide a sense of their useful capacity for such loads as flashlights, music players, radios, and the like. As with all discharge tests, the time to EOD voltage is a function of temperature: discharge time is a little longer at elevated temperatures, and shorter – possibly much shorter – at low temperatures.
When a constant resistance discharge is performed, cell capacity is expressed in minutes (or hours) of operation, rather than Ah. This is because load current decreases as the cell discharges, making calculation of Ah cumbersome at best (at least without a computer). We compare constant resistance and constant current discharges in the next paragraph.
CONSTANT CURRENT DISCHARGE
1.4.2
There is no such thing as a constant current load in nature. Battery manufacturers must use special equipment to perform a constant current discharge. A constant current discharge is useful to rate battery capacity because it provides a simple and direct way to compare batteries and their performance at different discharge currents. A constant current discharge always results in a battery rating in ampere hours.
You know now that the Ah you can get from a battery decreases as you increase the discharge current. Manufacturers perform the tests by connecting a constant current load (electronically controlled) and monitoring the terminal voltage until the EOD is reached. If you use the same EOD voltage for all discharge tests, you can then compare McIntoshes with Winesaps.
But how do constant resistance and constant current discharges really compare? We can gain insight by examining what happens in small primary batteries. Consider the data for a high-quality, AA alkaline-manganese primary cell. For a constant current discharge of 22 mA, the service life, to 0.8 V EOD, is 100 hours, for a total of 2.2 Ah.
We’d like to determine the equivalent constant resistance discharge. We can try to find it for either of two cases: choose the starting current to be the same as the constant current discharge, or choose the final current, at the end of discharge, to be the same. If we choose R (the load resistor) to be 64 ohms, the initial current at the start of discharge (about 1.4 V) will be about 22 mA, the same as the constant current. This yields a service life of about 160 hours. But the slope of the voltage-time discharge curve isn’t linear, so we don’t know the actual average discharge current, or the Ah extracted from the cell. The cell takes longer to get to 0.8 volts, but we don’t know if we actually get more out of it.
Another equivalent discharge is to use the manufacturer’s data to determine the R value for a service life of 100 hours, which is 43 ohms. Now the initial current (at 1.4 V) is 32 mA, so it seems like we’re getting more out of the cell, but the current drops as the voltage decreases, so we really don’t know. Again.
If we assume that the terminal voltage decreases linearly with time (it doesn’t, but this is only a test), we can estimate the Ah for the resistive discharge. The average voltage is 1.1 V, so the average current for a 64-ohm discharge is 17 mA, for a yield of 2.75 Ah. For the 43-ohm case, the average current is 25.6 mA, yielding 2.56 Ah. So we may, in fact, be getting more capacity for constant resistance than for constant current, which yields 2.2 Ah.
Note, however, that the manufacturer bases its tests on each discharge method supplying the same power at the end of discharge. This is the case where the final current would be the same for constant resistance and constant current, wherein the constant resistance discharge fares much worse. We get more, in the analysis above, only by tolerating lower power delivered near the end of discharge. Because of these differing test protocols, comparing the two discharge methods really isn’t meaningful.
Let’s look now at the constant-current discharge data for a large industrial battery; this example is a lead-acid battery rated 1,200 Ah to 1.75 VPC, with full-charge specific gravity of 1.240. Although the manufacturer doesn’t provide a Peukert constant, we can calculate it from the discharge data.
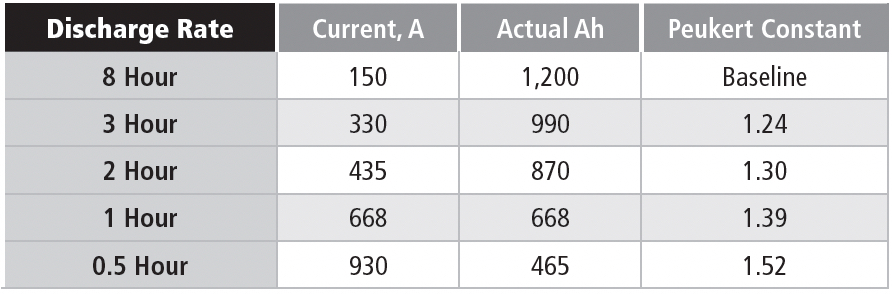

We see from Table 1d that the calculated Peukert constant actually increases with the battery discharge rate. Using a Peukert constant based on a low discharge rate will give misleadingly high capacity ratings for higher discharge rates. For example, using 1.30 (the constant at the 2 hour rate) would give a discharge time of 1.4 hours instead of the actual 1 hour for a 668A discharge.
In summary, using the tabular data provided by the manufacturer is the only reliable way to predict capacity at any discharge rate, even though all the discharges are to the same end voltage.
CONSTANT POWER DISCHARGE
1.4.3
Things get interesting now. While there aren’t any naturally occurring constant power loads, there are a lot of applications where electronic equipment overcomes nature. Uninterruptible Power Supplies (UPS) are ubiquitous in modern industry, frequently used to maintain a computer’s power during an emergency. If a device’s power demand is constant, the UPS presents a constant power load to the battery during discharge. Data sheets for batteries designed for UPS frequently provide constant power (also called constant wattage) discharge data, often down to the one-minute rate.
In this case, it’s possible to compare constant power and constant current discharges, as shown in Table 1e for a nominal 63 Ah battery (10-hour rate) discharged to 1.75 VPC.
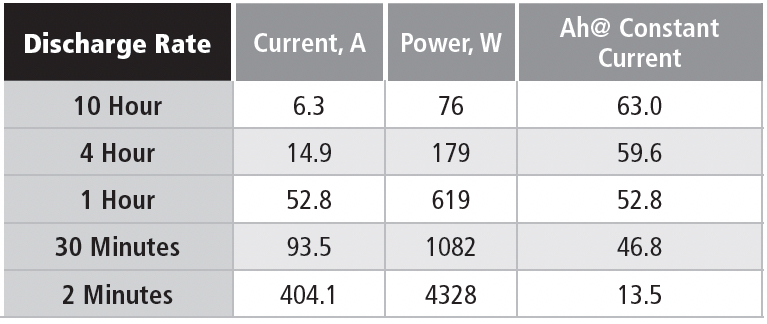
The battery is a six-cell unit, so the EOD voltage is 10.5 V.
Note that the available Ah is steeply related to the discharge rate, although not as extreme as in the battery used for the constant current example. This example is for a battery design optimized for high rate discharges. The significant point for these discharge data is that the power level in the constant power discharge is chosen to be equal to the starting power for the constant current discharge, which means that the currents are the same at the start of each discharge. The two discharge methods start at the same current, but the constant power discharge requires the current to increase as the discharge voltage drops.

As an example of these concepts, consider the discharge parameters for the 10-hour rate. The 76-watt discharge for the 10-hour rate has a starting current of 6.3 A, if the cell terminal voltage is 2.01 V, which is close to the open-circuit voltage. If the average discharge voltage is 11.25 V, then the average power delivered in the constant current discharge is 70.8 W, vs. 76 W in the constant power discharge. Using the same average voltage, the average current delivered during the constant power discharge is 6.75 Adc.
If you check the numbers on the higher discharge rates, you find that the starting power is reduced because the discharge voltage is less than 2.0 VPC at high discharge currents. This is due to the internal resistance of the battery; although low (only a few milliohms), at high currents it can reduce the discharge voltage of this battery by a volt or more.
WHERE DOES “UNUSED” CAPACITY GO?
1.4.4
By now, you are probably asking yourself, “If I can only get one-fourth of the capacity out of the battery at a high rate, where does the remaining capacity go?” The short answer is that it doesn’t go anywhere; it’s still in the battery. You just can’t get to it.
In a lead-acid battery, one of the causes of reduced capacity is electrolyte mobility, or rather immobility, and the permeability of the active material in the positive and negative plates. By permeability we mean the ability of the electrolyte to diffuse through the active material and convert it to discharge current. During discharge, the sulfuric acid in the electrolyte is part of the chemical reaction. The acid reacts with lead or lead peroxide in the plates, reducing its concentration in the electrolyte, especially at the interfaces with the active material of the plates. The active materials, lead and lead peroxide, in turn, are transformed into lead sulfate. It’s magic.
In other words, the sulfuric acid is turning into water. This reveals another cause of reduced capacity: the impedance (resistance) of the electrolyte is increasing, since water is a much poorer conductor of electricity than the sulfuric acid electrolyte. The increased resistance decreases the discharge terminal voltage even further. As the discharge continues, new sulfuric acid must migrate to the interface with the active material. This is the major electrochemical shortcoming of the lead-acid battery: the electrolyte must be involved in the chemical reaction.
At low discharge rates, the electrolyte concentration equalizes readily, and diffuses throughout the plates to contact most of the active material. At high discharge rates, however, the acid concentration cannot diffuse fast enough to make use of all the active material. The result is that the battery seems to be discharged (even though there is a significant amount of potentially useful active material left in the plates), and the terminal voltage starts to collapse. At some point, it is necessary to terminate the discharge to avoid permanent damage to the battery.
At very low discharge rates (the 20-hour rate or lower), you have the opposite effect. Most of the active material is available to the electrolyte, and the battery approaches full discharge at a fairly high discharge voltage. Therefore, you must terminate the discharge at a higher voltage than the “nominal” EOD voltage of 1.75 VPC. For low-rate applications, manufacturers generally provide data for discharges to 1.81 VPC.
At very high discharge rates, you can discharge a battery as low as 1.5 VPC. But always check with the battery manufacturer concerning your application, to be sure that your discharge rates and EOD voltages are optimized.
In the preceding sections, we’ve discussed idealized discharges: constant resistance, constant current, and constant power. In the real world, of course, battery loading is often variable, especially in utility applications. Complex discharge profiles have variations in current and depth of discharge. Later, we’ll look at sizing a battery for these inconsistent loads.
HOW DO I SIZE A STATIONARY BATTERY?
1.4.5
Sizing for a Constant Load
1.4.5.1
Before you read about sizing batteries, be sure you’ve read the introduction to Discharging Secondary Batteries (SECTION 1.4).
Although there are several steps, sizing a stationary battery for a constant load is fairly straightforward. Your first step is to determine the actual ampere hours that the battery must deliver to satisfy site or load requirements. If you have a constant current load, you’re there: simply multiply the current by the operating time you need. Remember that at high rates, capacity is reduced, so check the discharge curves or tables for the battery type you want to use. But also, at high rates, you may be able to discharge to a lower EOD voltage.
This means that you already have a good idea of what battery you’re going to use. Battery size is driven by the total Ah needed, so you can’t necessarily trade off battery physical size (or cost) for discharge time. There may be surprises: after you’ve finished the calculations, you might find that the battery you selected won’t do the job, requiring you to shift to a larger package.
For constant resistance or constant power, you need to convert the requirement into constant current, using any of the methods discussed above. Some guesswork is involved, so a good rule of thumb is to add another 5% or 10% as a design safety margin. For a constant power discharge, you could use the current at the end of discharge; this is the most conservative approach. Or you could use the constant power discharge curves, if the manufacturer provides them.
Once you have the Ah requirement, proceed as follows:
- Determine the number of cells required. This is dictated by the upper and lower voltage limits for the site equipment, the charging voltage required for the chosen cell type, and the EOD voltage for the discharge rate.
Example: A substation dc bus has an upper operating limit of 145 Vdc, and a lower limit of 105 Vdc. You’ve chosen a VRLA cell that requires a float voltage of 2.250 VPC at 25 °C, and the manufacturer recommends that the battery never be equalized. However, you know that the ambient temperature will go as low as 50 °F (10 °C), and you’re using a temperature-compensated charger. The charger output voltage will be 2.325 VPC at 50 °F, temperature-compensated from the recommended 2.250 VPC at 77 °F. Therefore, the maximum number of cells allowed is 145 Vdc ÷ 2.325 VPC = 62.For this application, EOD voltage should be no lower than 1.75 VPC. The minimum number of cells, if discharged to 1.75 VPC, is 105 ÷ 1.75 = 60. Sixty cells, of course, is the normal number for a (so-called) 130 V battery and is safe for the upper limit. We’ll use 60 cells. In this case we’re using the EOD voltage at 77 °F.If you had a light load, with a long discharge time, say 24 hours or more, you would normally need a higher EOD voltage. Manufacturers publish discharge curves for an EOD of 1.81 volts. In this case, you could use 58 cells, and they would still meet your minimum system requirement of 105 V at the end of discharge.For a battery that requires periodic equalization (a flooded cell, for example), you need to use the equalize voltage instead of the float voltage to calculate the maximum number of cells to meet the upper voltage limit. In the example above, a battery that requires an equalize voltage of 2.33 VPC at 77 °F would be equalized at 2.40 VPC at 50 °F. The maximum equalize voltage, 144.6 V, just squeaks under the maximum permitted bus voltage.
- Adjust the Ah for the battery end of life capacity. Most manufacturers of lead-acid batteries rate the end of life as the point where the initial capacity is reduced to 80%. Therefore, multiply your Ah requirement by 1.25.
- Adjust for temperatures below normal room temperature. If your battery is going to live forever in an environment of 25 °C (77 °F), lucky you. But a lot of applications are in unheated or poorly heated locations. The manufacturer’s data sheet will give you a derating factor for temperature, or provide a graph or table of initial capacity vs. temperature.
Example: A lead-acid battery rated for 100 Ah at 25 °C might provide only 80 Ah at 0 °C. If your battery will experience significant time at this low temperature, multiply the Ah by 1.25. For the example above, with a low ambient of 10 °C, a correction of 1.1 would be adequate.
Don’t adjust for temperatures over 25 °C, even though some spec sheets provide the data. The available capacity does increase at elevated temperatures, but that’s gravy, added to your margin. But beware of sustained elevated temperatures. See How Does Temperature Affect Battery Discharge? (SECTION 1.4.6).
- Now go back and check the curves for your selected cell type. It’s possible that the corrections you’ve made will require you to select a larger cell. This isn’t the time to cut corners. You don’t want to get midnight telephone calls five years from now. I assure you that I have no financial interest in industrial battery manufacturers. I’m just trying to help.
How do I size for a real-world load profile?
1.4.5.1.1
The information in the last section may be good for a UPS or similar application, which is close to constant power. But the chances are good that your world isn’t like this. In utility and other stationary applications, the battery may be required to deliver widely varying load currents for an hour or several hours during a power emergency. The load profile for a dc system might look like Figure 1e during a five-hour backup period.
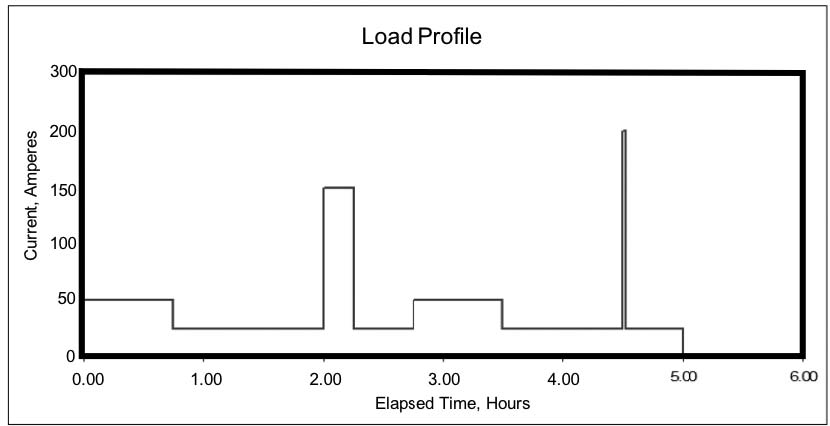
For this hypothetical discharge profile, the continuous standing load is 25 Adc, with intermittent loads of an additional 25 to 125 Adc. Near the end of the required backup time, there is a very short requirement for an additional 175 A. This transient load – known as a momentary load – may last only a few seconds, but we treat it as if it lasts for a full minute.
Why a full minute? Experience and testing show that even a very short but high-demand load reduces the battery voltage after just a few seconds; the reduced voltage means that the battery capacity is reduced even after the load is removed. While conservative, this is a good approach, especially if the demand is near the end of the discharge where the battery is nearly depleted.
If you add up all the load currents in the load profile shown above, you can calculate the total Ah removed from the battery. [In the example above, it’s almost 200 Ah.] It seems that you should be able to size the battery based on those Ah. Remember, though, that higher current drains result in a lower capacity rating for the battery – this means that the battery needs to be sized larger than the calculated Ah would indicate, to be able to support the higher demands throughout the discharge profile.
If it’s not as simple as adding up the load currents, then how can you do it?
1.4.5.1.2
There’s some history there, of course. In the 1950s, Earle A. Hoxie of the Electric Storage Battery Company of Philadelphia (Exide, among other brands), developed a method of calculating the battery size based on individual load currents, their discharge time increments, and the rated capacity of a single positive plate for a given battery type (over a range of discharge rates). This method was incorporated into IEEE Standard 485, “Sizing Lead-Acid Batteries for Stationary Applications.” The method is complicated, cumbersome, iterative, and tedious. It’s also very accurate.
Of course, you’re going to keep me honest, so I used Hoxie’s method to calculate the actual Ah requirements for the example above. The worksheet is shown in Appendix B. I used the example cell type given in IEEE Standard 485, knowing that you will check my work. I calculated for 1.75 VPC end voltage, using only room temperature. At the end, we find out that we need a 400 Ah battery to do the job in this example.
Naturally, to do a complete job, I would repeat the calculation for other plate sizes and battery types, until I found the most economical solution, or optimize for other requirements, such as floor space. I would also have to factor in the expected lowest operating temperature at the facility. Doing all this would be like mowing your lawn with a pair of scissors.
Is there a way to size the battery without all that hassle?
1.4.5.1.3
Affirmative! Battery manufacturers provide computer software that does the whole job for you. Just specify the cell type you think will work and put in the currents and time periods for the discharge profile. The programs provide instant gratification, and allow you to run through many options quickly. Since most programs include a database of the manufacturer’s cell types and their characteristics, you might not even have to preselect a cell type. Of course, the software won’t give you the price; you’ll still have to get that from the manufacturer.
Corrections
1.4.5.1.4
The sample calculation in Appendix B is uncorrected for the many contingencies surrounding battery applications. You will need to add a design margin and correct for temperature if your battery spends much time at cooler temperatures. You also need to add some margin for battery aging. These corrections are discussed in Sizing for a Constant Load in SECTION 1.4.5.1. The sizing programs will correct for temperature.
There is one more cause of reduced capacity. Brand-new batteries may not be fully formed; that is, they don’t yet deliver their full rated capacity when they’re shipped from the factory. It may take several months on float charge to attain that capacity. Normally, your corrections for design margin will compensate for that shortfall.
HOW DOES TEMPERATURE AFFECT BATTERY DISCHARGE?
1.4.6
In the earlier sections on primary batteries, and the general descriptions of secondary batteries, we noted that battery performance decreases at low temperatures, and is a little better at elevated temperatures. For a battery whose capacity is rated at 25 °C, capacity might be reduced to 70% at 0 °C. At 37 °C, you might gain 7% or 8% capacity.
There’s more to the story, though. A lead-acid battery, operating at very low temperatures, say -20 °C, has significantly decreased capacity. The electrolyte at that temperature is less mobile and may freeze at the interface with the active material of the plates as the battery discharges and the specific gravity decreases. If ice crystals form inside the active material, the plates may be damaged. If you can avoid freezing, however, the capacity will recover when the battery returns to room temperature.
At the upper end, there is more risk of damage. At, say, 37 °C (body temperature), you gain a little discharge capacity, but remember that you’re taking this out of the capacity rating at room temperature. In other words, you may be causing a deeper discharge than the battery is rated for at room temperature. If you discharge to 1.75 VPC at 37 °C, it’s like discharging an extra 5% at room temperature. In addition, battery life decreases at elevated temperatures: at 37 °C, the battery life will be less than half of the rated life at room temperature.
For more in-depth information on temperature effects, see Temperature Effects in CHAPTER 5.
CELL REVERSAL: HOW DOES IT HAPPEN? WHY AVOID IT?
1.4.7
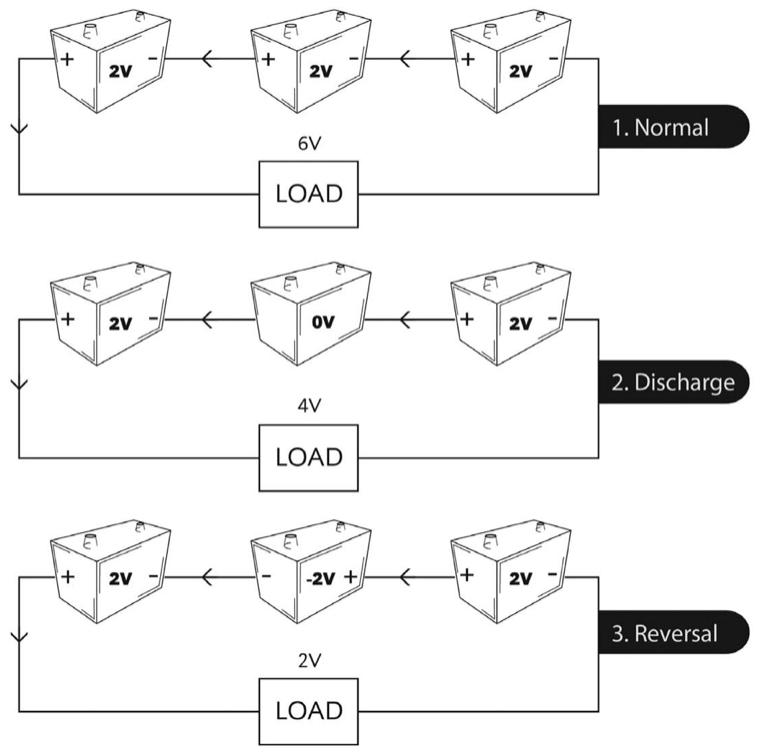
We mentioned cell reversal in discussing secondary batteries in general. Cell reversal can occur in any series string during discharge. Cell reversal is bad. We picture the process in Figure 1f.
Due to manufacturing tolerances, differences in aging, and cell imbalances resulting from frequent cycling, some cells in a series string will have less discharge capacity than others. If you’re discharging a battery to a very low voltage, it’s possible that a cell with significantly lower capacity will become fully discharged while the remaining cells still have a way to go. In a string of, say, 60 cells, the loss of one 2 V cell might be tolerated by the load, and the system wouldn’t send an alarm.
Now what happens to that discharged cell? It’s no longer contributing to the load current, but load current flows through it – only now, it’s in reverse. That is, the rest of the battery is trying to charge the weak cell in reverse, turning the anode into a cathode and vice versa.
Not good! As you have read, the positive and negative plates in a lead-acid battery are designed differently, each optimized for its intended use. During discharge, the active material in each plate converts into lead sulfate. Trying to convert the active material into its opposite polarity is not only futile but causes permanent damage. It’s possible that normal charging cannot later recover the cell.
The capacity of a cell whose polarity is reversed is small, and the cell will gas after only a few minutes, producing an explosive mixture of hydrogen and oxygen, and consuming electrolyte. This causes permanent capacity loss in a VRLA cell.

You can avoid cell reversal by paying strict attention to EOD voltages. A lower limit of 1.5 VPC should be a safe cutoff voltage for large battery strings at high discharge rates; use 1.75 VPC or higher for moderate to low discharge rates.
We recently had an extended power failure, and weren’t able to shut down the dc loads. Our battery went flat. I mean zilch. Can we recover anything?
You’re in a difficult situation. When you finally were able to disconnect the load, was there any voltage at all on the battery?
It went up to about 80 volts (for a string of 60 cells).
OK. That's an average of about 1.3 VPC. When your open-circuit voltage is less than about 1.8 VPC, the battery is in real trouble.
Why is that?
During discharge, the electrolyte is gradually changing to water. Remember that the open circuit of a lead-acid cell is, roughly, 0.85 plus the specific gravity of the electrolyte. When you have a fully-charged cell with a specific gravity of, say, 1.215 (pronounced twelve fifteen), the open-circuit voltage is 2.06 V. If the battery were filled with pure water, you’d have no voltage at all: no electrolyte, no voltage.
But an open-circuit voltage of 1.3 VPC means that there’s some electrolyte left, and some non-discharged active material. You can’t really calculate the specific gravity, since the average would be less than 1.0, an impossibility. Since some of the cells are probably reversed, that means that some have a higher open-circuit voltage, and therefore some measurable specific gravity.
You're getting very technical. What's the bottom line?
The battery is probably toast. But you may be able to recover a little capacity, which could tide you through small emergencies until your new battery arrives. Call your salesperson.
So what’s the lowest open-circuit voltage that I should ever see?
No lower than 2.0 VPC. That means a specific gravity in the discharged state of 1.150 (eleven fifty), which would keep the battery from freezing down below 0 C. Before you try to measure the open-circuit voltage, remember to let the battery rest for a while, with no load or charger connected. It will appear to be lower at the end of a discharge, and it will start to recover within a few minutes after the load is removed.
HOW DO I PROTECT A DC SYSTEM FROM SHORT CIRCUITS?
1.4.8
Despite all our best efforts to avoid catastrophes, it’s possible that equipment failure, human error, or a misalignment of the stars might cause a battery to be short-circuited. This is not a good thing.
It’s a good idea to plan for this eventuality. A dc system should be designed so that a fault in any connected equipment will activate circuit protection for the branch that is faulted. This will protect the battery and maintain the operation of the rest of the dc system. Usually, some last-ditch circuit protection is provided for the battery also. If all the protective devices are coordinated properly, branch circuit protection will always activate before the main battery protection activates, which would leave the entire system in the dark.
So, how much short-circuit current should we protect against? A common rule of thumb is that a flooded lead-acid battery can deliver about ten times its one-minute discharge rating for anywhere from a few milliseconds to several seconds. As the fault continues, the battery impedance rises quickly, so the short-circuit current will decrease, although not to a safe level. Some cell designs, such as VRLAs designed for high-rate discharges, can produce higher instantaneous fault currents, but the current may fall off quickly because of the electrolyte immobility. If the manufacturer’s data sheet doesn’t give the one-minute discharge rate, you can use the nominal Ah rating, which would provide a good approximation (that is, the short-circuit current would be ten times the stated Ah rating). Some data sheets provide the short-circuit current rating.
So what happens if branch circuit protection fails? Of course, a fuse somewhere will clear the overcurrent, protecting the battery from permanent damage. And of course, New York City will go dark. Again. But what if a fuse doesn’t clear? Or what if the system designer simply omitted protection?
System faults, of course, have some impedance. There is the internal resistance of the battery itself, and the impedances of the wiring to the dc bus, the branch circuits, the fuses that aren’t blowing, and so forth. Plus, the faulted equipment might still support a little voltage. The higher the system impedances, the lower the battery fault current will be. But we should assume that the current, if sustained, will be high enough to melt internal battery components, causing permanent damage, and possibly fire, or reverse several cells in the battery.
Battery manufacturers’ spec sheets may give you values of battery short-circuit current, or internal resistance, or both. You can use these values to design the last-ditch protection. Also, you can consult IEEE Std. 1375, “Guide for the Protection of Stationary Battery Systems,” which will tell you everything you need to know and a lot more. The standard includes a procedure for calculating cell internal resistance.
Appendix B has a sample calculation of cell internal resistance. One more thing to remember: the values for short-circuit current are for a fully charged lead-acid battery. As a battery discharges, its internal impedance rises. If a fault occurs toward the end of a battery discharge, the available short-circuit current may be reduced by up to 50%. This isn’t true for NiCd or NiMH batteries: since the specific gravity doesn’t change for these systems during discharge, the internal resistance is more constant, and the available short-circuit current at the end of discharge is closer to the value for a fully charged battery.